
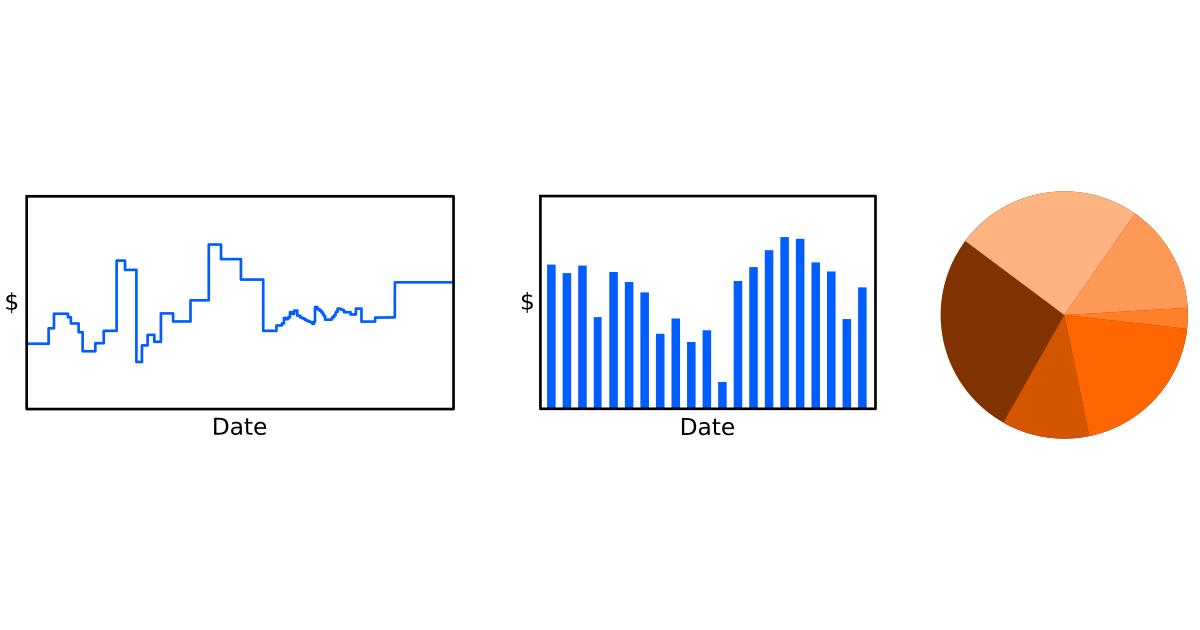
Once once we have designed accounting software in accordance with basic accounting principles, it is beneficial to generate plots of the various account balances. Depending on the account and what we would like to show, the relevant plot is either a line graph, a bar plot or a pie chart.
Wealth containers are most commonly viewed as line graphs: money in savings account vs time, net worth vs time, and so on. This process works best if the software can handle subaccounts. Net worth is an account which handles no money directly but has sub accounts like checking account, savings account, wallet, etc. Net worth vs time is going to drop when money moves out of any of those accounts and up when money moves in. The subcategories in the net worth account can be visualized as a pie chart to show asset allocation (where is our wealth contained?). This becomes more important as a greater percentage of wealth moves to brokerage accounts and real estate. Once money becomes a wealth management problem instead of a budgeting issue, the relative distribution of assests becomes important.
Spending categories are best viewed as bar plots: monthly spending on groceries vs time, monthly spending on miscellaneous vs time, etc. It is also useful to view them as pie charts to answer the question "What fraction of my spending is housing, food, etc?" A line graph is a deceptive way to view spending because the concern is not the absolute amount of money spent on groceries since records began, the concern is the rate money is being spent on groceries. A bar graph more clearly indicates that each point is the sum of all transactions over a given date range (monthly, yearly, etc) than a line graph.
Visualizing income is similar to visualizing spending; for the same reasons, a bar graph is better than a line graph. For self-employed individuals or those with multiple and variable income sources, a pie chart is a useful visualization to show where the money came in over a given period of time.
