

Photo credit to Pixabay
In late 2011, I wrote my first Python script. It was an accounting script which works on the same principles that this web-based one uses today. Being it was my first Python script, it was neither competently composed nor efficient in its execution. In the intervening years, I have re-written it from scratch 4 or 5 times. The structure of the underlying data files has never changed. See this article for some more explanation of that parallel project.
2019-11-24 in Accounting
Design of an accounting system - how I designed mine
In 2020, after learning some Javascript and D3, I wrote a script for this blog to accomplish the same tasks with some improved visuals.
Before reading this tutorial or using the accounting app, make sure you fully understand double-entry accounting.
2019-06-12 in Accounting
The fundamental theory of accounting — money is a conserved quantity

You should not. Fortunately this application is designed so you do not have to. No part of your accounting file or any summary data is sent to my server. This entire application is written in Javascript. When you visit the app web page, your browser downloads a Javascript program I wrote. When you run an analysis of the sample accounting file, or your own, all that computational work is done in the web browser by your computer. I do not collect any data from this app and I never will. Your financial data is not mine to own and so I never intend to collect it unless I am doing so explicitly (as in, you send it to me via email because you need help).
The easy way to demonstrate this is to open the webpage, then unplug your ethernet cable or turn off your wifi. The app will still work as long as the .js files are in your web cache.
This script will work on any data and header file supplied by the user in the format of the examples. The column labels in the top row must appear exactly as they are in the examples. The 'val' column must be valid numbers, the dates must appear as YYYY-MM-DD, and the data file must only reference accounts in the header file. Account codes are case sensitive. The script does some limited error checking but this functionality is by no means complete.
The size limitations are purely a function of your computer's memory and processing power because that is the machine running the code. I wrote it as efficiently as I know how but it is Javascript, not C. It is never going to be suitable for 10,000 transactions a day like you might have at a mid size company. I ran some dummy files through this with 20,000+ lines. It worked fine and my computer is nothing particularly powerful.
My personal accounting csv has been maintained this way since late 2011 with reports generated by a Python script with the same functionality as this web app (though with less pretty visuals). In the past 9 years, it has grown to 11,000 transactions. This web app works fine for my data on a laptop which cost $1000 2 years ago.
To get started, download the example files [head.csv, test_data.csv]. These files contain entirely made up figures for an imaginary man. I sat around with friends one Friday night and wrote completely fictious accounting records for Jerry, a 30-something, gay, zoo maintenance worker, living in Colorado. It was a fun night, I'm the life of the party like that.
Jerry has five wealth containers (Credit Union car loan, Chase checking account, Amex BlueCash Preferred card, Citi DoubleCash card, and a wallet). In early 2015, he bought a truck for $38,000 at $0 down, 5% interest, and an 8 year loan term. As of January 1, 2020, he still owes $16,000. His income is either from the zoo where he works or miscellaneous odd jobs (building a deck for a friend, patching drywall in another friend's apartment). His spending is broken into the five normal categories (housing, healthcare, transportation, groceries, and misc). His misc category is further subdivided into restaurant food, skiing (his primary hobby), and dog care (for his puppy named Pickles). The account codes corresponding to these accounts are given in the head.csv file. We made up about 300 transactions for the year 2020 which are contained in test_data.csv.
The head.csv file determines the structure of the accounting scheme. That is to say, the head.csv relates children and parent accounts. All accounts may have children, may be children of other accounts, and may have transactions directly within themselves. In a reasonably designed system, there will be accounts which have every possible combination of those attributes. In Jerry's accounting scheme, "Net worth" has lots of children but no transactions directly reference it. "Misc" has transactions directly, has children, and is itself a child of "Expenses".

[Caption] Visual representation of Jerry Doe's accounting file. Final parenthesis contain the account code used to reference the account in the test_data.csv. It is highly recommended you sketch out something like this before designing your accounting structure.
In this accounting program, money moves from one account to another but is never created nor destroyed. If you had begun tracking your money since birth, this would work perfectly. Your first transaction would be something like "$1 from grandma to wallet". However, no one starts that early so no one has perfect accounting records going back to their birth. Therefore we need a way to create money in the accounting system when we begin tracking our money. "outside" is a dummy account used to populate our initial account balances. We never run reports on "outside" as its total value is just \(-1 \times\)"Net worth" at the date we began keeping records.
When we run a report, we need to supply two files, a header file and a data file. We also need to specify 6 inputs: the account code we are running a report on, the start date, the end date, contains (any keywords we want to see in the transaction descriptions), not contains (any keywords we do not want in the transaction descriptions), whether we want a filtered output, and whether we want to display accounts with $0 balance and 0 transactions.
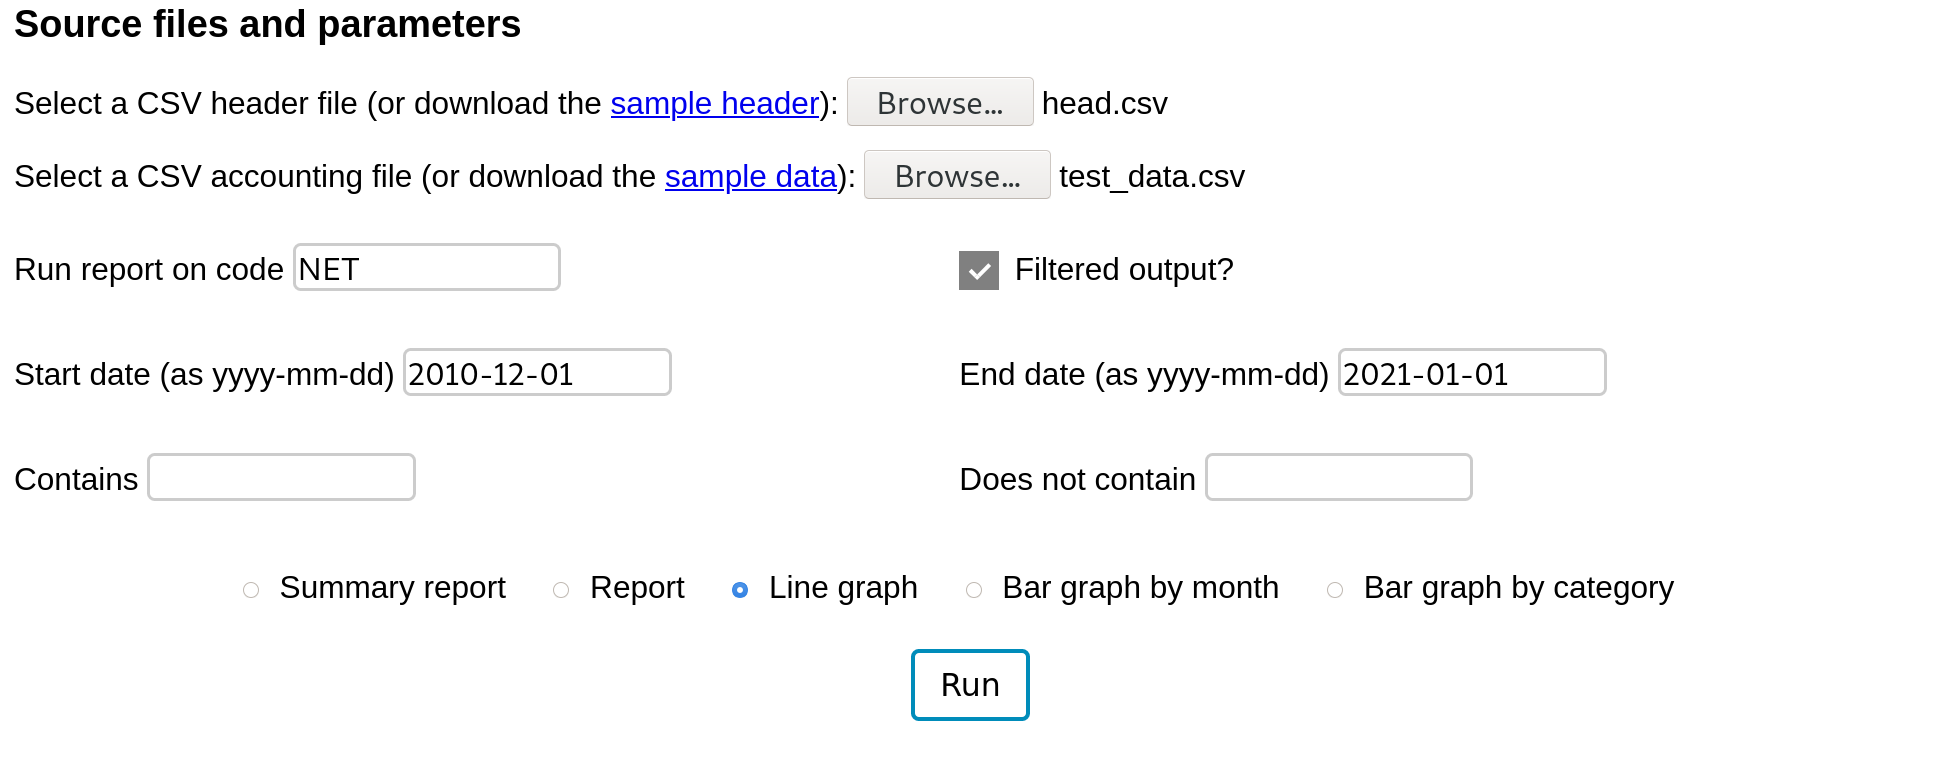
If we are looking to compare Jerry's Amex BlueCash Preferred card to his bank statement, we want to list all the recent transactions but we want the total to include everything, not just the recent transactions. See the example below:
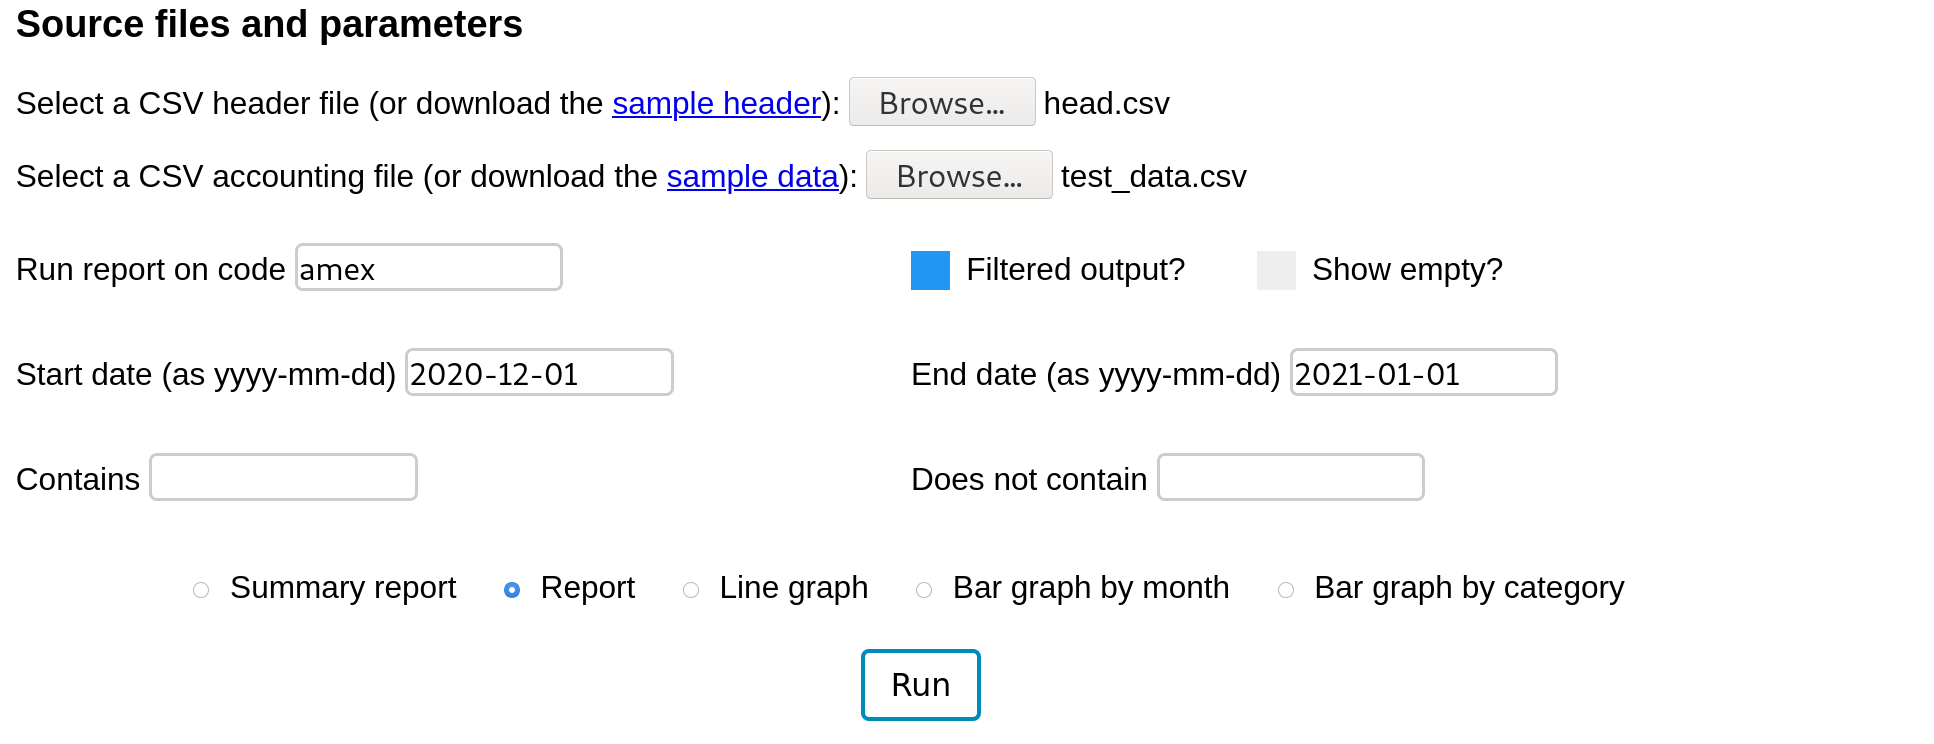
This produces a report similar to a bank statement where the last transactions within the date range are shown but the total includes every transaction since the account was opened. The start date is included in the date range (transaction date >= start date) but the end date is not (transaction date < end date).
Now consider that the last Valero gas station charge has not yet posted to his amex account. Jerry wants to run this report while ignoring that charge. He can not add 'Valero' to the not contains filter. First, he has other Valero transactions he would like to keep in there. Second, the output total contains all the transactions whether they meet the filter criteria or not (since we have not checked "Filtered output?"). To accomplish this routine task, add an 'X' to the notes column in the data file, re-select it ('Select a CSV accounting file:'), and re-run the report.
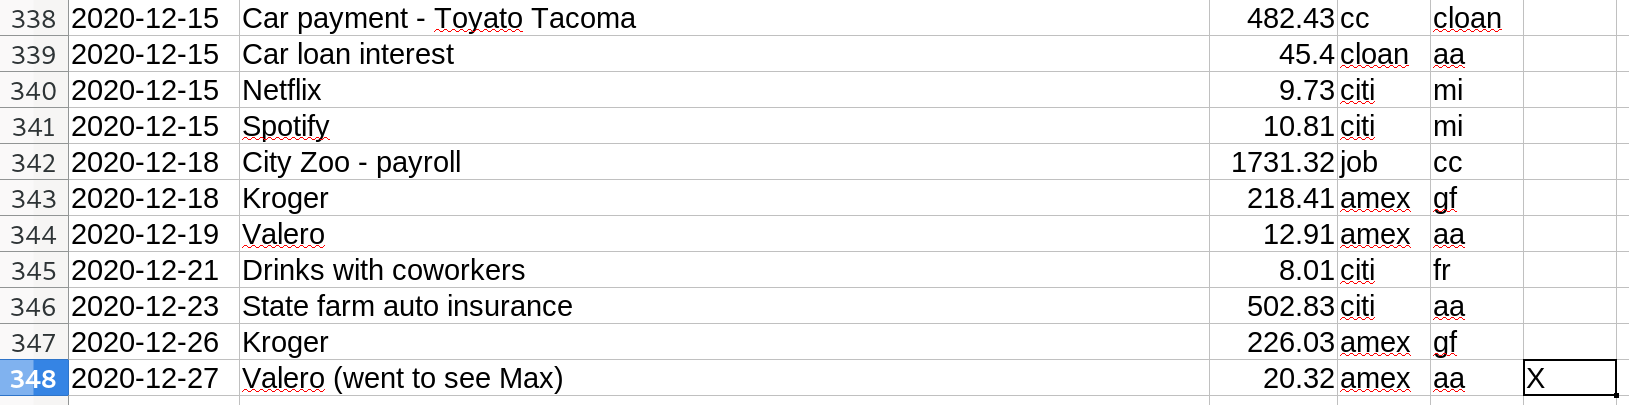
Using the exact same inputs as before, we have successfully ignored that last Valero transaction. I use this feature every time I balance my credit cards and bank accounts.
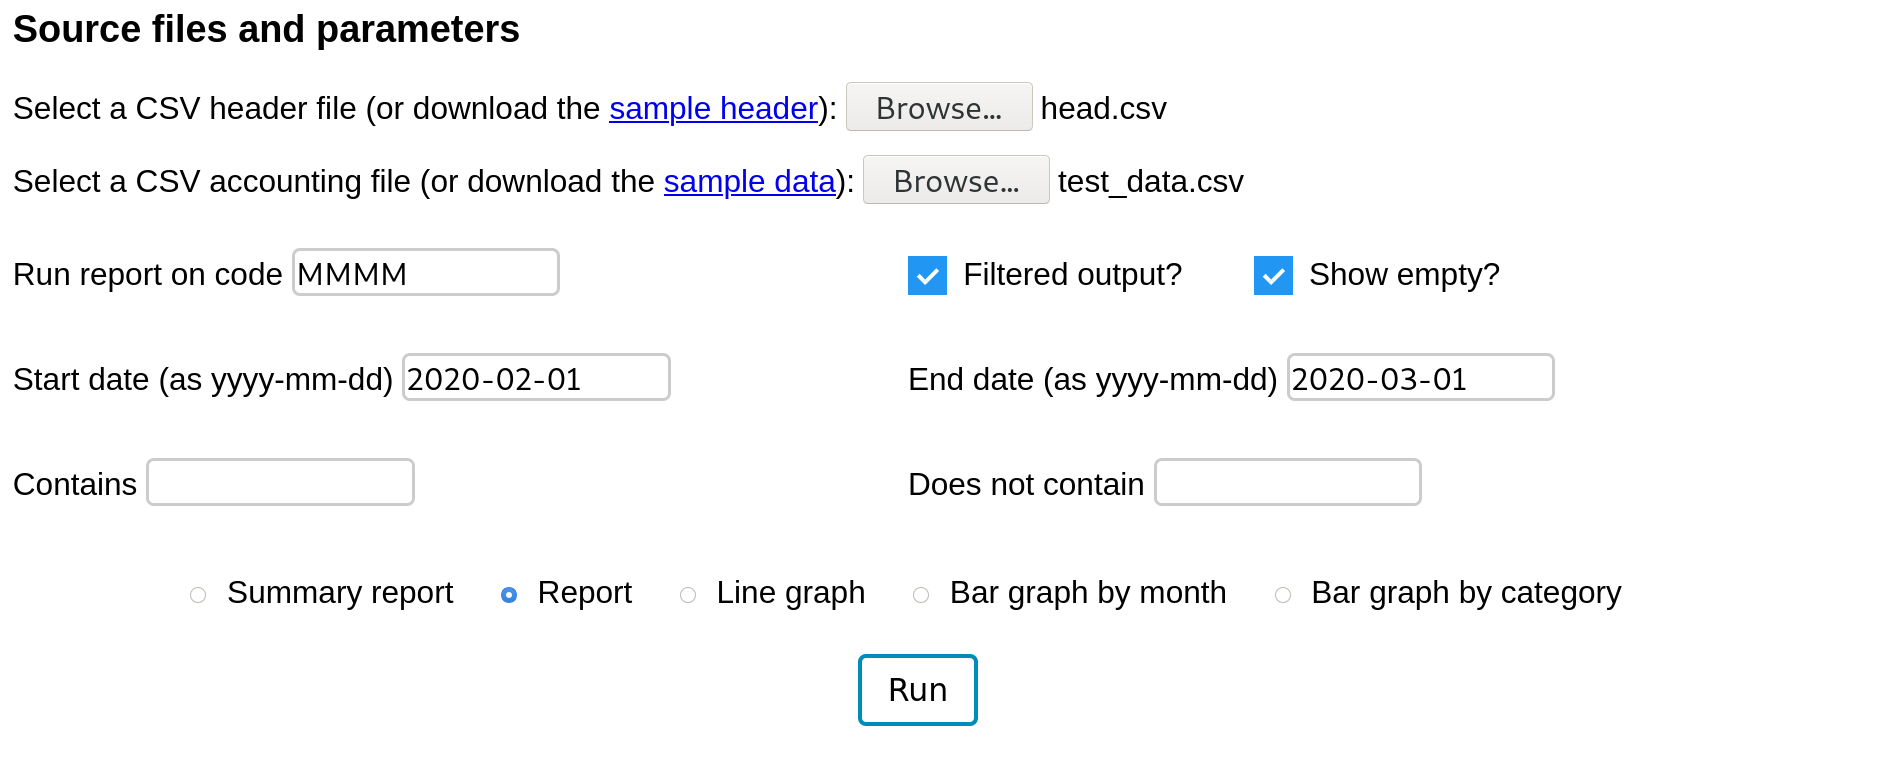
To understand this report, look closely at the header file and the account named 'Balance', account code 'MMMM'. This account has no transactions but it has two children 'Income' and 'Expenses'. In my experience the most useful view is on a month by month basis. We are also interested in filtered totals now. We are not interested in 'money spend on groceries since we began keeping track'; we are interested in 'money spent on groceries this month'.
Here are the inputs for a monthly expense report for Jerry in February.
And here is Jerry's financial February.
Had we unchecked the "Show empty?" box, the "Skiing" and "Dog care" accounts would not have been shown. As we move between jobs, we will accumulate income accounts that will be completely inactive for large periods of time. Some expense categories are only occassionally active. The "Show empty?" option is a useful way to unclutter a report.
This also illustrates something important about privacy and accounting. Notice that Jerry is paying extra for Grindr premium (a gay hookup app). There's nothing wrong with Jerry spending his extra cash on Grindr but it raises some important questions about privacy. If you choose to really keep track of your spending, your accounting file will remember all your hedonism. Every trip to the liquor store, every lottery ticket and slot machine, every drug deal, every drunk amazon purchase. . . it all stays in the accounting file forever. For this reason, you should think long and hard about with whom and how you share your accounting records. You need to understand what comes with that kind of intimacy before you invite strangers to look over your books in this level of detail.
I often use the contains feature to keep track of projects. For example, in February, fictious Jerry here bought some supplies, built a deck for Eric, and was paid for labor and materials. All those transactions contain 'ERICDECK' in the description. We can run a report with 'ERICDECK' in the contains field to accurately see how profitable that side project was.
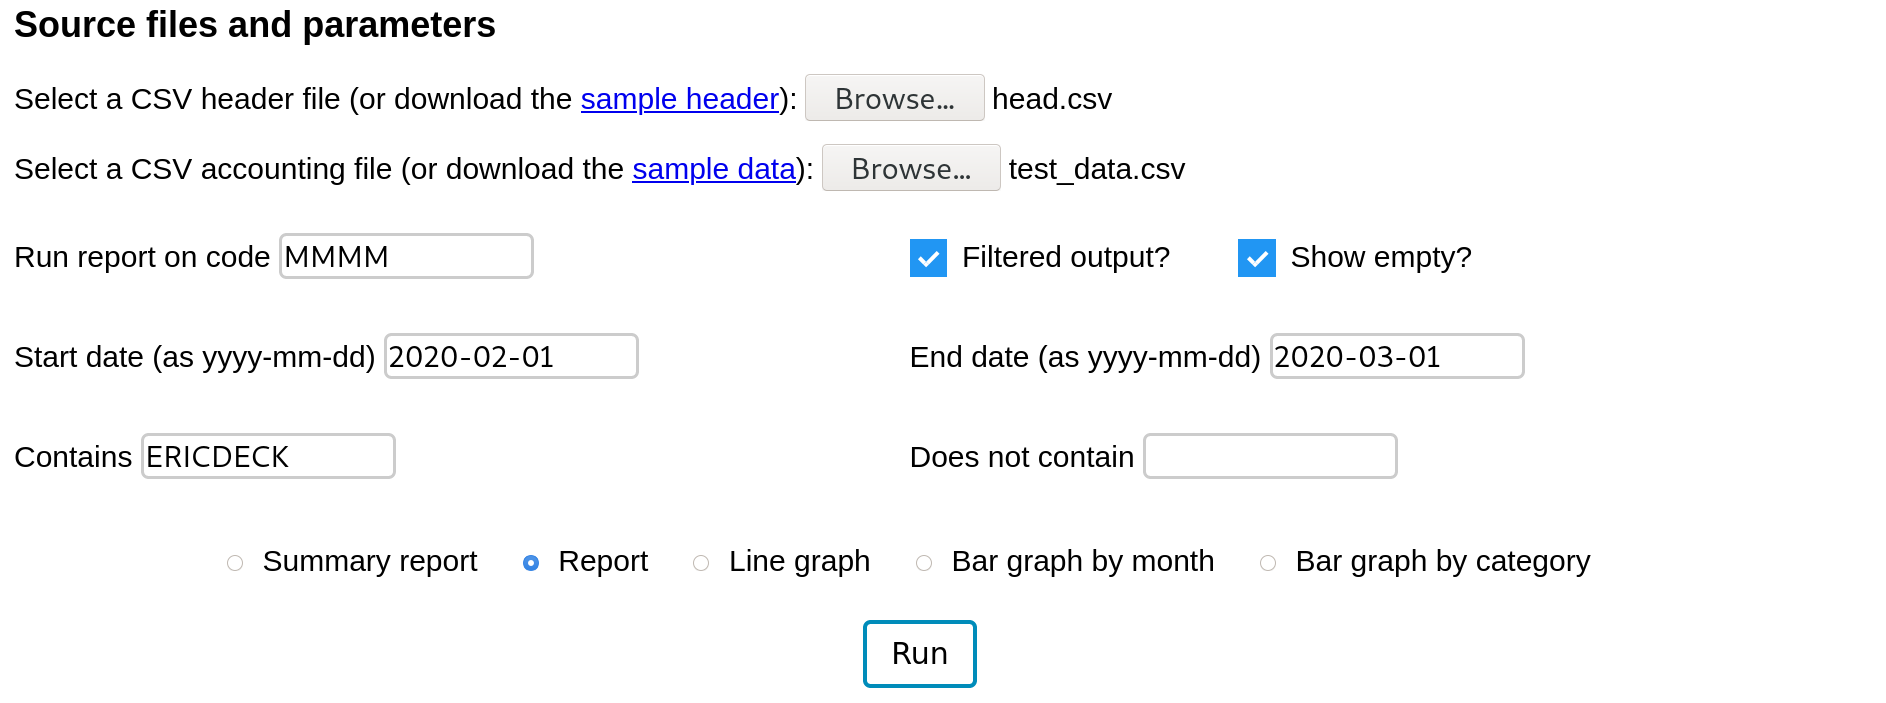
Had we unchecked the "Show empty?" box, only the Miscelaneous income account would have printed. The "Show empty?" option is a useful way to unclutter a report.
This is particularly useful for activities that cover several categories like vacations. When I take a trip, there are gas purchases, airplane tickets, rental cars, restaurants, activity fees, etc, spread across all my expense accounts. However, because I enter them with the same keyword in the description, I can accurately gauge the cost of my trips.
All the tools we have discussed so far are good for analyzing recent transactions. However, if you print a report with a year's worth of data, it is unmanageable. My household generates 50-250 transactions per month so that can easily be 2000 lines of data to display. This is what graphs are for. We can see the trends without seeing all the individual transactions.
For example, this is Jerry's net worth over time. In January, he a net worth of -$14,000 after a paycheck. Most of this is debt due to the car loan. By August his net worth was -$8,000 so he saved about $6,000 in 8 months. However, he had several net negative months in the last third of the year. The graph is interactive so it allows zooming by highlighting and restoring the original by doubleclick. Notice that Jerry's net worth plunges on Dec 31, 2019. This is because in this sample data, he started recording January 1. However there are a number of transactions on Dec 31 from 'oo' (the dummy account) to and from all his wealth containers. This would be unnecessary if he began this record keeping when he made his first dollar. These 'oo' transactions at the beginning allow us to assign bank balances the day record keeping begins. This results in a large drop at the beginning because Jerry is in debt. He has a few thousand in his checking but he owes a lot more than that in a car loan.
Another way to see this is a bar graph with monthly bars. Select "bar graph by month" and press "Run".
The last feature of this app is a bar graph expense breakdown. Normally this is shown with a pie chart. However, human eyes are really bad at interpreting pie charts. See this data-to-viz article on the shortcomings of pie charts. Producing a pie chart, in most cases, is an announcement by the creator that they are either deliberately being deceptive or they are incompetent. Pie charts have another major shortcoming in this application — they cannot handle negative values. Since account values are regularly both positive and negative, the pie chart is an unworkable solution here. For these reasons, this app creates no pie charts.
Take a look at the breakdown by category for February.
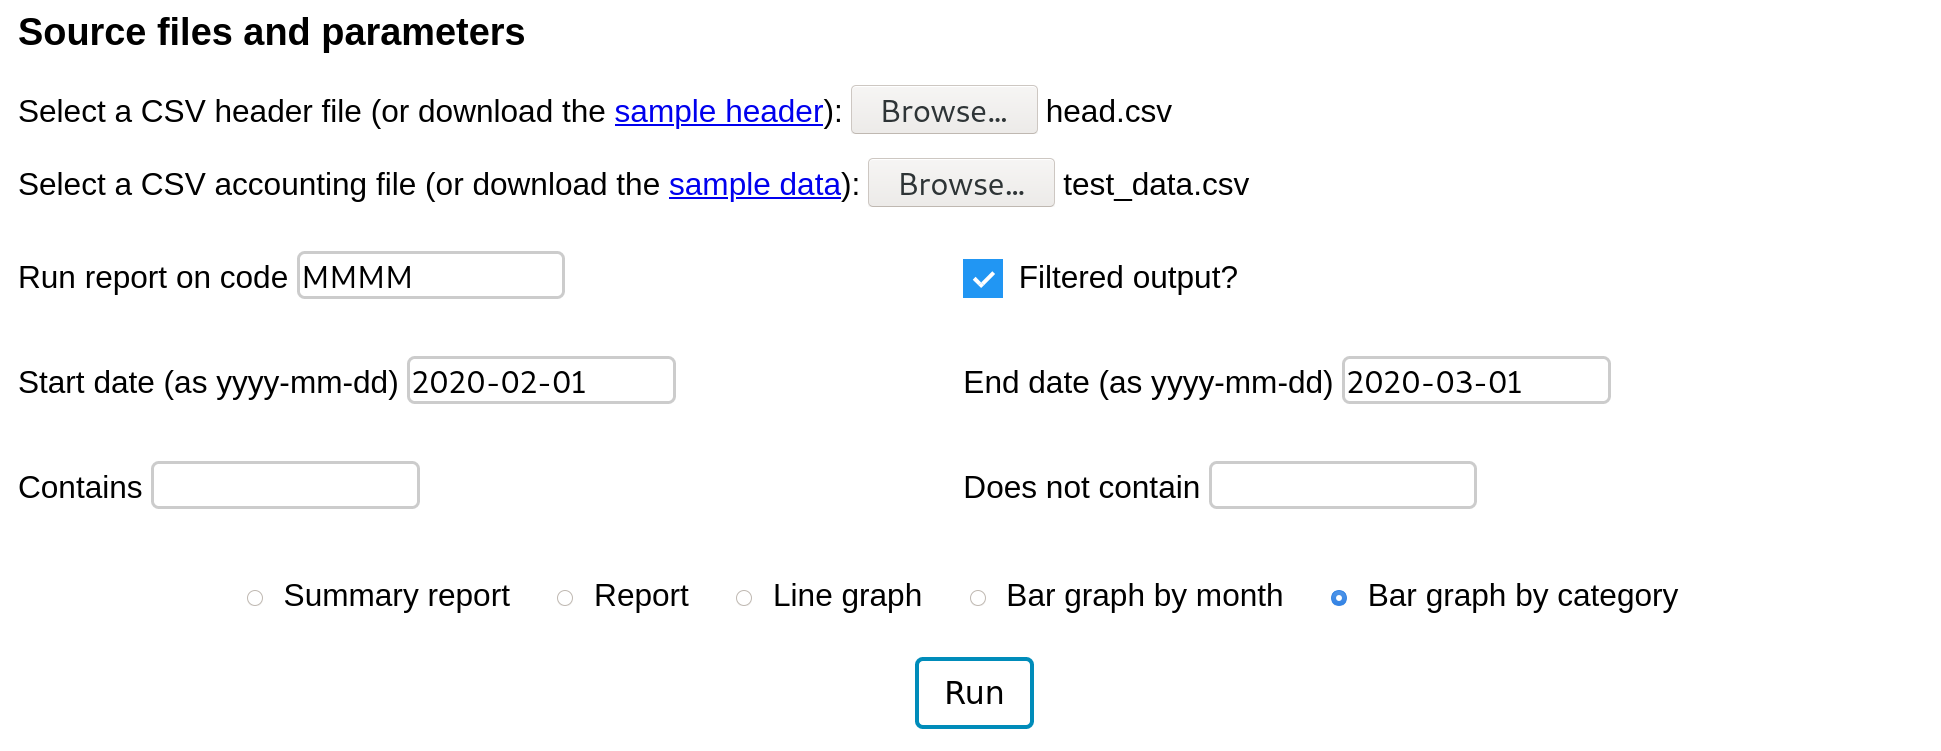
This is not super helpful. It's just one bar. However, when you click on the bar it breaks apart into child accounts.
Now click on both those bars to expand them.
Of those, 'Misc' can be broken down further but the others have no child accounts.
As you play with the visual, you can click on labels to regroup children into their parent accounts. By highlighting portions of the y-axis, you can zoom in. If this cuts off any of the bars, they will be shown in a crosshatched pattern.